- Calculate reward-to-risk from entry, stop and target.
- Estimate the win rate needed to break even before costs.
- Separate an attractive ratio from a credible trading setup.
Build the ratio from price levels
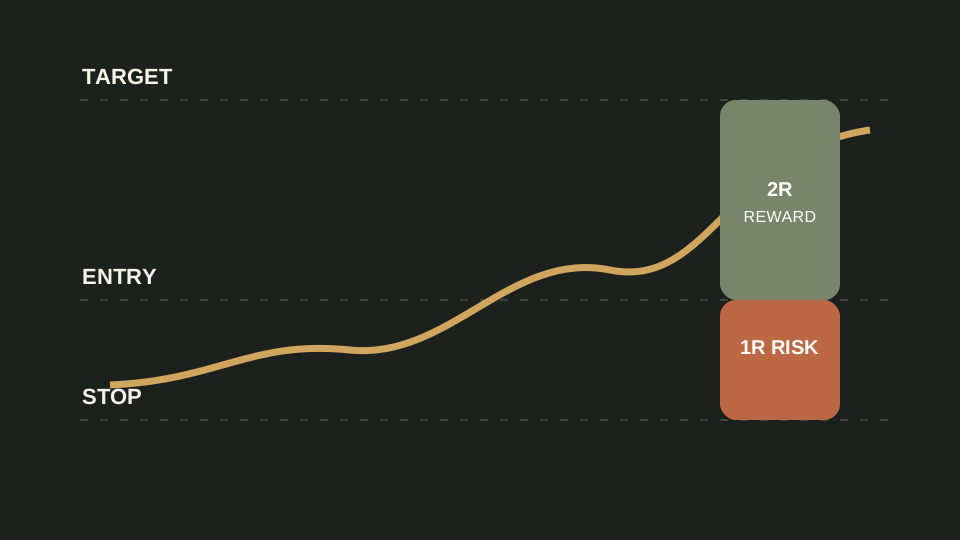
For a long example, planned risk is entry minus stop and planned reward is target minus entry. Divide reward by risk. An entry at 100, a stop at 96 and a target at 108 has four units of risk and eight units of potential reward, or 2:1 reward-to-risk.
For a short example the direction reverses, but absolute distances keep the arithmetic readable. The stop and target should reflect invalidation and market structure; moving either number only to produce a prettier ratio makes the calculation less useful.
Connect the ratio to break-even win rate
A 2:1 reward-to-risk plan has a theoretical break-even win rate near 33.3% before costs because one full winner offsets two full losses. A 1:1 plan needs about 50%. This does not mean any 2:1 setup is profitable: real exits can be partial, stops can slip and fees reduce expectancy.
Expectancy combines average win, average loss and the frequency of each. Review a meaningful sample rather than assuming that the target will be reached exactly.
Use realistic levels and record the outcome
Check whether the target sits beyond a likely barrier, whether the stop is inside ordinary noise and whether liquidity supports the planned size. Record planned and realised R-multiples so you can see whether execution matches the model.
A skipped trade can be a good outcome when the available reward does not compensate for the defined risk. The ratio supports consistency; it does not create certainty.
- Define invalidation before calculating size.
- Include fees, spread and possible slippage.
- Track realised R, not only planned R.
- Never widen risk after entry to preserve hope.
A 2R plan
Entry 50, stop 48 and target 54 creates 2 of risk and 4 of potential reward. The plan is 2R, but only if 48 genuinely invalidates the idea and 54 is a plausible exit—not numbers chosen after seeing the ratio.
Turn the concept into a reviewable decision.
Write the instrument, the evidence you checked, the important assumption and the condition that would make your original idea wrong. Then use a relevant calculator or paper-trading example before considering real exposure. This step connects the lesson to a repeatable process and makes hindsight easier to detect.
Current prices, regulations, fees and product specifications can change. Verify them at a primary source and keep the educational example separate from your personal financial circumstances.
Carry these four ideas forward.
- Mark entry, stop and target.
- Calculate risk before reward.
- Compare the break-even rate with tested evidence.
- Record costs and realised R.
Three questions before the next tab.
Choose the answer that best matches the lesson. This is a memory check, not a market signal.
Continue with original sources.
These links provide definitions and current context. Product rules, regulation and network details can change, so verify time-sensitive information at the source.
Before you move on
Is a higher risk-reward ratio always better?+
No. A distant target may be less likely to fill, and a very tight stop may be hit by ordinary movement.
What does 1R mean?+
One R is the initial amount planned to be lost if the setup is invalidated.
Does the ratio predict profit?+
No. It describes a planned payoff relationship and must be combined with probabilities, costs and execution.